


7 Powerful Tools That Instantly Improve Process Quality
Discover seven practical tools that help improve process quality, reduce errors, and make workflows more consistent across business operations.
Many businesses lose time, money, and customers because their work processes are not consistent.
One day everything runs well, and the next day mistakes appear again. This happens in factories, service companies, offices, digital teams, product development, and even small businesses.
The truth is simple. Quality does not improve by luck. Quality improves when we measure, track, and fix problems using the right methods.
This is why many successful companies use Quality control tools to understand what is going wrong, where the errors come from, and how to prevent them in the future. These tools help teams see patterns, remove waste, avoid rework, and deliver better results every day.
Why Process Quality Matters
Process quality is important because it affects every part of a business. When quality is low, problems grow quietly in the background.
Here are common results:
-
customer complaints increase
-
Delays become normal
-
Teamwork becomes stressful
-
The cost of rework rises
-
Employee confidence drops
-
reputation weakens
-
growth slows
When process quality improves, businesses see benefits like:
-
faster work delivery
-
better customer satisfaction
-
lower waste and errors
-
stronger trust and repeat sales
-
happier employees
-
clear and stable workflow
Quality is not only about fixing mistakes. Quality is about building a system where mistakes do not happen again. That is why learning and using Quality control tools becomes a strong advantage for any business.
What Makes These Tools Powerful
These tools help because they:
-
Give clear visibility into problems
-
allow teams to make decisions based on data
-
reduce guessing and assumptions
-
help leaders find root causes
-
help workers understand their role in improvement
-
support continuous progress
When businesses depend only on opinion, improvement becomes slow. When businesses depend on data, improvement becomes steady and reliable.
The 7 Tools Explained in Simple Language
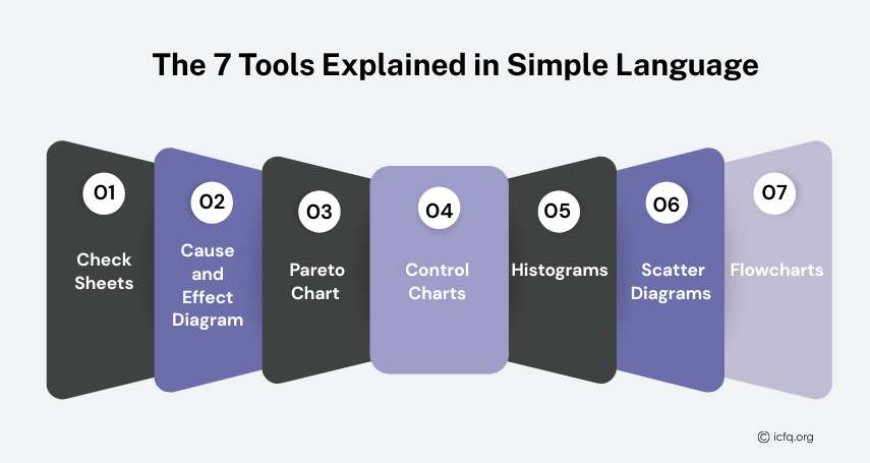
1. Check Sheets
This tool helps you collect data in a simple and organized way. It is a sheet where you mark how many times a problem happens. It is useful when you need real numbers, not guesses.
When to use:
-
when starting to study a problem
-
When you want to track frequency
-
When the issue repeats often
How it helps:
-
brings clarity
-
shows patterns
-
helps teams agree on facts
Example:
A team measures how many customer orders are delayed each day. After one week, they know the real size of the problem.
2. Cause and Effect Diagram
This tool helps you find the reason behind a problem. It is also called the Fishbone Diagram. You list all possible causes, such as people, process, machines, materials, methods, and environment.
When to use:
-
When the problem keeps coming back
-
when nobody knows the real cause
-
When opinions are different
How it helps:
-
organizes thinking
-
removes blame
-
leads to the root cause
Example:
A factory uses it to understand why product defects increase. They discover the root cause is poor machine cleaning.
3. Pareto Chart
This tool helps you see which problems matter the most. It follows the 80/20 idea, meaning most results come from a few causes. With this chart, you focus on what gives the biggest improvement.
When to use:
-
When resources are limited
-
When you want a fast impact
-
when multiple issues exist
How it helps:
-
prioritizes efforts
-
avoids waste of time
-
gives quick progress
Example:
A support team sees that most customer complaints come from just two service steps. They fix those steps first.
4. Control Charts
This tool helps you see if a process is stable over time. It shows data points in a chart and indicates when the process goes out of control.
When to use:
-
when monitoring performance
-
when checking consistency
-
When you want early warning signs
How it helps:
-
prevents failure
-
reduces downtime
-
maintains steady output
Example:
A packaging line uses control charts to detect variation. They adjust before errors grow.
5. Histograms
This tool helps you understand how data is spread out. It shows data in bars so you can see the shape and distribution.
When to use:
-
When you want to study variation
-
When averages are not enough
-
When comparing performance ranges
How it helps:
-
reveals behavior patterns
-
shows normal and unusual results
-
supports better planning
Example:
A training manager checks skill test scores and sees that most employees fall below the expected level. This guides training plans.
6. Scatter Diagrams
This tool helps you see relationships between two factors. It shows whether one thing affects another.
When to use:
-
when testing assumptions
-
when looking for correlations
-
When trying to predict results
How it helps:
-
supports decision making
-
removes blind guessing
-
shows cause connections
Example:
A sales team compares delivery time with customer satisfaction and sees that satisfaction rises when delivery is faster.
7. Flowcharts
This tool helps you draw a process step by step. It shows the path of work and makes it easy to spot delays, confusion, or unnecessary steps.
When to use:
-
When starting the process improvement
-
when training new employees
-
when simplifying work
How it helps:
-
builds clarity
-
removes extra steps
-
improves efficiency
Example:
An office reviews onboarding steps and removes repeated approval loops.
How These Tools Improve Real Business Results
Businesses that use Quality control tools gain advantages such as:
-
fewer mistakes
-
better planning
-
faster workflow
-
clear accountability
-
smoother teamwork
-
lower operating costs
-
stronger customer trust
These tools also help leaders:
-
measure performance
-
track change
-
prove improvement
-
support certification needs
Employees benefit too, because:
-
their work becomes easier
-
expectations are clear
-
stress reduces
-
Success becomes visible
How to Start Using These Tools in Your Company
Here are simple steps to begin:
-
Choose one process that needs improvement
-
collect real data, not opinions
-
Select the right tool for the situation
-
involve people who do the work
-
document what you find
-
Make small improvements first
-
measure again to confirm results
Improvement becomes a habit when teams repeat these steps regularly.
Common Mistakes to Avoid
Many companies fail because they:
-
use tools without understanding
-
collect data but never act on it
-
try to fix everything at once
-
Ignore employee feedback
-
Stop after short-term improvement
Quality is not a one-time activity. It is a continuous journey.
Why These Tools Work in Any Industry
These tools are useful in:
-
manufacturing
-
healthcare
-
education
-
logistics
-
hospitality
-
IT services
-
retail
-
construction
-
consulting
-
government work
Any place where a process exists, improvement is possible.
Strong process quality does not happen by chance. It happens when teams learn to see problems clearly and fix them in a structured way. These seven methods make that possible. If you want fewer defects, fewer delays, happier customers, better teamwork, and more stable growth, these tools will guide you there.
Businesses that act early gain an advantage. Businesses that wait fall behind.
If you want support in improving your processes, training your team, or applying Quality control tools for real results, you can reach out and start your improvement journey today.