


Key Process Improvement Tools in Six Sigma Methodology
key process improvement tools in Six Sigma that drive efficiency, reduce defects, and support continuous quality improvement using the DMAIC approach
Improving quality, reducing waste, and increasing efficiency are central goals in any organization. Six Sigma, a data-driven methodology, helps achieve these objectives through a structured approach to process improvement. At the heart of Six Sigma are essential process improvement tools that enable teams to identify issues, analyze data, and implement effective solutions.
What Are Process Improvement Tools?
Process improvement tools are techniques or frameworks used to analyze, evaluate, and enhance business processes. In the Six Sigma methodology, these tools are critical for identifying inefficiencies, reducing variability, and driving consistent, high-quality outcomes.
The goal of these tools is to ensure that improvements are data-driven, sustainable, and aligned with customer expectations. From root cause analysis to control charts, these tools support every phase of Six Sigma's DMAIC (Define, Measure, Analyze, Improve, Control) framework.
DMAIC: The Framework for Applying Process Tools
The DMAIC cycle is the backbone of Six Sigma. Each stage in this cycle uses specific process improvement tools to guide decision-making:
-
Define: Clarify the project goals and customer deliverables.
-
Measure: Quantify the current process performance.
-
Analyze: Identify the root causes of defects or inefficiencies.
-
Improve: Develop and implement solutions.
-
Control: Sustain improvements over time.
Pareto Chart: Prioritizing Problems with Clarity
A Pareto Chart is one of the most powerful process improvement tools for visualizing and prioritizing problems. Based on the 80/20 rule, it helps teams focus on the 20% of causes that lead to 80% of the problems.
Key activities when using the Pareto Chart include:
-
Data Collection and Categorization: Gather relevant data and categorize issues or defects to understand the frequency of each.
-
Chart Construction: Create the Pareto Chart by plotting categories in descending order of occurrence, typically with bars and a cumulative percentage line.
-
Issue Prioritization: Identify the "vital few" problems contributing to the majority of the defects or inefficiencies.
-
Root Cause Focus: Use insights from the chart to concentrate root cause analysis efforts on the most impactful issues.
-
Strategic Improvement Planning: Allocate resources and develop solutions based on high-priority areas identified through the chart.
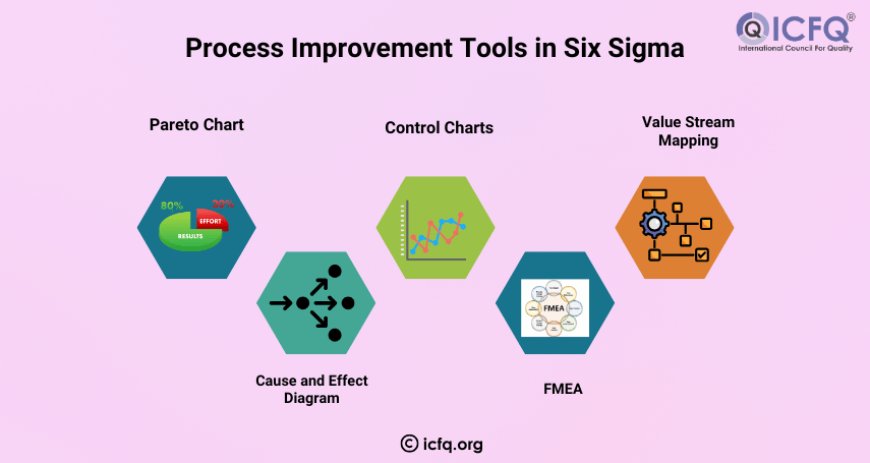
Cause and Effect Diagram: Tracing Problems to Their Roots
Also known as the Fishbone or Ishikawa diagram, this tool helps teams brainstorm and categorize potential causes of a problem. It is widely used during the Analyze phase to explore all possible contributors to a defect or issue.
Key activities when using the Cause and Effect Diagram include:
-
Problem Definition: Clearly state the effect or problem to be analyzed—this becomes the "head" of the fishbone diagram.
-
Category Identification: Identify major categories of potential causes (e.g., Methods, Materials, Machines, People, Environment, and Measurement).
-
Brainstorming Possible Causes: Collaborate with team members to list all possible contributing factors under each category.
-
Diagram Construction: Organize causes visually in a fishbone structure to show the relationship between the problem and its potential sources.
-
Root Cause Exploration: Analyze the diagram to identify which causes are most likely contributing to the problem and need further investigation.
Control Charts: Monitoring Process Stability Over Time
Control charts are essential for the Measure and Control phases of DMAIC. They track process performance over time and help determine whether variations are due to common causes (inherent in the process) or special causes (correctable issues).
Key activities when using Control Charts include:
-
Chart Setup: Plot the data on a control chart with a central line (mean), upper control limit (UCL), and lower control limit (LCL).
-
Variation Analysis: Differentiate between common cause variation (inherent to the process) and special cause variation (indicative of issues).
-
Pattern Identification: Look for trends, shifts, or abnormal patterns that signal instability or potential problems in the process.
-
Process Adjustment and Monitoring: Take corrective action if special cause variation is detected and continue using the chart to ensure ongoing process stability.
Value Stream Mapping: Visualizing the Flow of Value
Value Stream Mapping (VSM) is used to visualize the flow of materials and information through a process, from start to finish. This tool highlights waste, bottlenecks, and delays, making it easier to streamline the workflow.
Key activities when using Value Stream Mapping (VSM) include:
-
Current State Mapping: Visualize the entire process flow, including steps, delays, and information handoffs, from start to finish.
-
Identifying Waste: Highlight non-value-added activities such as wait times, unnecessary movements, or overproduction.
-
Data Annotation: Include key data points like cycle times, inventory levels, and lead times to better understand process performance.
-
Future State Design: Develop an improved version of the process that eliminates waste and improves flow efficiency.
-
Holistic Process Evaluation: Use the map to uncover improvement opportunities that may be hidden in isolated task-level analysis.
FMEA: Preventing Failures Before They Happen
Failure Modes and Effects Analysis (FMEA) is a proactive tool used to anticipate and mitigate potential failures in a process. It involves listing possible failure modes, evaluating their severity, likelihood, and detection, and prioritizing actions to address them.
Key activities when using Failure Modes and Effects Analysis (FMEA) include:
-
Failure Identification: List all the ways a process, product, or service could potentially fail.
-
Impact Assessment: Evaluate each failure mode based on its severity, occurrence likelihood, and detectability.
-
Risk Priority Number (RPN) Calculation: Multiply the three factors (severity × occurrence × detection) to prioritize failure modes.
-
Action Planning: Develop targeted actions to reduce or eliminate high-risk failure modes.
-
Implementation and Follow-Up: Apply the corrective measures and re-evaluate to ensure risk reduction has been achieved.
How Process Improvement Tools Strengthen Six Sigma
-
Structured Approach: Tools align with the DMAIC framework to ensure systematic, data-backed decision-making.
-
Root Cause Analysis: Help teams dig deeper into problems instead of applying superficial fixes.
-
Improvement Validation: Provide metrics and visuals to confirm that changes lead to real gains.
-
Process Control: Ensure improvements are sustained and variation remains within acceptable limits.
-
Cultural Impact: Foster a mindset of continuous improvement and accountability across the organization.
At ICFQ, we specialize in providing globally recognized Six Sigma certifications that empower professionals to lead effective quality improvement initiatives. With the right knowledge and the right tools, you can transform challenges into opportunities and deliver value at every level of your organization