


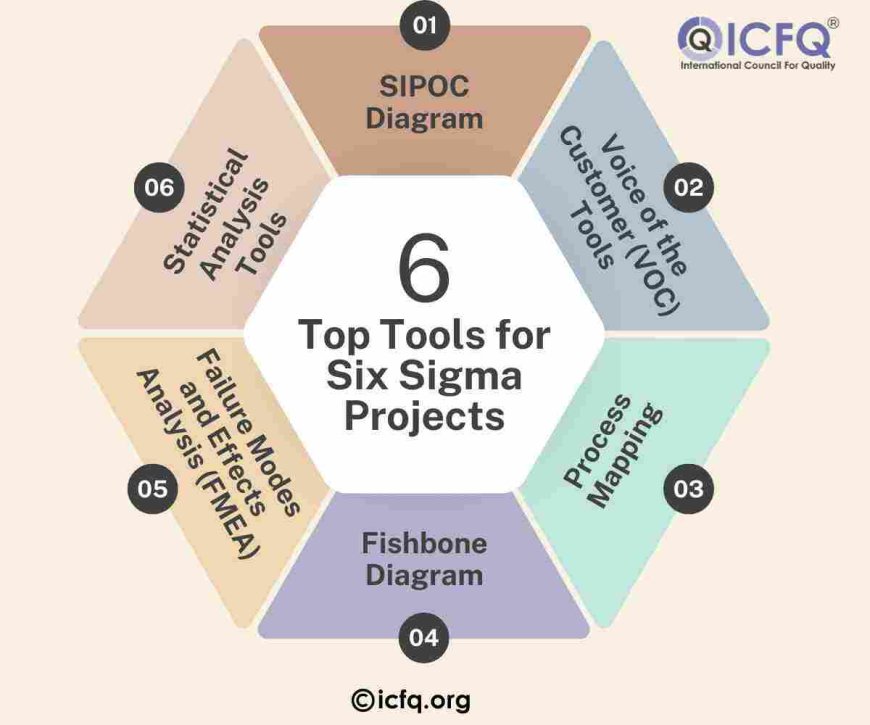
Top Tools for Six Sigma Projects Made Easy
Find the best tools for Six Sigma projects to make improving quality easier. Simplify your processes and achieve better results with these essential Six Sigma tools
Six Sigma is a method that uses data to make businesses better by reducing mistakes and differences in how things are done. It works for all kinds of processes, whether it's making products or handling transactions. The main goal is to make things work smoother and better by finding and fixing problems.
Tools are important in Six Sigma projects. They help teams look at data, understand how processes work, and find solutions. Some common tools include flowcharts to see how things move, diagrams to find out why things go wrong, and statistical software to analyze data. These tools help keep projects organized, make smart decisions based on facts, and track progress. By using these tools, teams can run projects better and get more consistent and accurate results.
Project Charter
A project charter in Six Sigma is a foundational document that outlines the scope and objectives of a project, serving as a blueprint for both the team and stakeholders. Its purpose is to provide a clear direction and set the boundaries of the project, ensuring that all team members are aligned towards the common goals.
Key components of a Six Sigma project charter include:
-
Problem Statement: This part describes the issue the project will tackle. It outlines the specific problem in the current process that needs fixing, focusing the project's efforts.
-
Project Scope: This defines what the project will cover and what it will not. Setting these boundaries helps keep the project on track and avoids it getting too big to manage.
-
Goals: These are the clear outcomes the project aims to reach. They should be straightforward and measurable, like reducing waste by a certain percentage or cutting down on process time. These goals help measure the project's success.
-
Team Roles: This lists who is involved in the project and what each person will do. It includes roles like the project leader, who oversees the project, and team members, who each have specific tasks. Clear roles help everyone know what they need to do.
SIPOC Diagram
A SIPOC diagram is a simple tool used in Six Sigma to give a big-picture view of a process. It breaks down the process into five parts: suppliers, inputs, processes, outputs, and customers.
- Suppliers: These are the folks who give us what we need to start the process, like materials or information.
- Inputs: These are what we get from the suppliers, like materials or data, that we need to do the process.
- Process: This is what we do with the inputs to turn them into outputs, like following steps or doing tasks.
- Outputs: These are the results we get from the process, like finished products or services.
- Customers: These are the people who get the output, like other departments or outside clients.
Using a SIPOC diagram at the start of a project helps everyone get a quick grasp of the whole process. It shows how stuff goes through the process and who's part of it. This makes it easy to spot where things could be made better and ensures everyone knows what the project is about.
Voice of the Customer (VOC) Tools
Voice of the Customer (VOC) means understanding what customers want and don't want. It's super important for projects, especially in making products better or improving quality. By knowing what customers need, projects can aim to meet those needs and make customers happier.
To effectively gather VOC, several tools can be employed:
-
Surveys: These are like questionnaires sent to customers to ask what they think. They're good for getting lots of opinions quickly.
-
Interviews: These are one-on-one talks with customers to get detailed thoughts and feelings. They can find out things surveys might miss.
-
Focus groups: These involve getting a bunch of customers together to chat. It helps to see why customers like or dislike certain things.
Process Mapping
Process mapping is a technique used to visually describe the flow of work in a process. It's really important in Six Sigma, which is all about making things work better and fixing problems in business processes. With process maps, teams can see how everything moves along in a process, like tasks and information. There are two common types of process maps:
-
Flowcharts: These are simple diagrams that show the steps of a process in order. They use different shapes to represent different types of actions and arrows to show the direction of the process.
-
Swimlane Diagrams: These diagrams are like flowcharts but with extra lines that separate the chart into lanes. Each lane represents a different person or department involved in the process. This helps show who is responsible for each step.
Cause-and-Effect Diagram (Fishbone Diagram)
A cause-and-effect diagram, also known as a fishbone diagram, is a tool used to identify and visually display the potential causes of a specific problem or effect. This is particularly useful in Six Sigma projects for pinpointing the root causes of defects or issues.
-
Identify the problem. Clearly state the problem or effect that needs investigation. Write it at the head or mouth of the fishbone.
-
Add major categories: Branch off from the main line with lines slanting upwards and downwards. Label these with potential cause categories relevant to the problem. Common categories include methods, machines, people, materials, measurements, and environment.
-
Brainstorm Causes: For each category, think of possible specific causes of the problem and add these as smaller "bones" of the appropriate category lines.
-
Analyze the Diagram: Look at the completed diagram to identify the most likely root causes. These are often causes that appear frequently across different categories or seem to have a strong influence on the problem.
Failure Modes and Effects Analysis (FMEA)
Failure Modes and Effects Analysis (FMEA) is a structured approach for identifying all the possible ways something can fail, analyzing the reasons for those failures, and determining their potential effects. The objective of FMEA is to help teams identify and prioritize potential problems in a process, product, or design before they occur. This proactive method helps in planning and implementing effective strategies to mitigate or eliminate risks.
-
Identify Failure Modes: List all the ways each component of a process or product can fail. These are called failure modes.
-
Analyze Effects: For each failure mode, assess the potential consequences if that failure does occur.
-
Determine Causes: Identify possible causes for each failure mode.
-
Prioritize Risks: Use a scoring system to rate the severity of each effect, the likelihood of each cause, and the detectability of each failure mode. Multiply these scores to get a Risk Priority Number (RPN) for each failure mode.
-
Mitigate Risks: Focus on the highest RPNs to develop action plans that reduce the likelihood of failure or minimize the impact of failures.
Statistical Analysis Tools
Statistical analysis tools are fundamental in Six Sigma for understanding data trends and making decisions based on factual evidence. These tools are important because they help teams make decisions based on facts and data instead of guesses or feelings. Some key statistical tools used in Six Sigma include:
-
Control Charts: These charts help monitor processes over time. They display how a process behaves and indicate when it is moving outside of predetermined limits, signaling potential issues.
-
Regression Analysis: This tool assesses the relationship between variables. It helps in understanding how the typical value of a dependent variable changes when one or more independent variables are varied, which is crucial for predicting outcomes and understanding influential factors.
Pareto Analysis
The Pareto Principle, also known as the "80/20 rule," is a key idea in Six Sigma that says most of the problems come from a small number of causes. Pareto charts, based on this principle, show these important factors visually. They list the causes in order of importance, so you can see which ones are the biggest issues. By using Pareto analysis, Six Sigma teams can focus on fixing the main problems first. This helps them make the most significant improvements in process efficiency and quality by concentrating their efforts where they'll have the biggest impact. It's a smart way to solve problems and make things work better.
Whys and Control Plans
The 5 Whys technique is a method used in Six Sigma to find the root cause of a problem by repeatedly asking "why." It helps teams dig deeper to uncover the underlying issues causing a problem. To use it effectively, stay open-minded, involve different team members, and focus on facts rather than assumptions.
Control plans are documents used in Six Sigma to maintain improvements after a project is finished. They outline steps and metrics to ensure processes stay on track. Control plans specify what to monitor, like inputs and outputs, and who is responsible for keeping an eye on things. By following control plans, organizations can make sure improvements stick around and keep delivering benefits even after the project ends.
In summary, several key tools play essential roles in Six Sigma projects. The 5 Whys technique helps teams uncover the root causes of problems by repeatedly asking "why." Pareto analysis and Pareto charts prioritize efforts by focusing on the most significant factors contributing to a problem, while control plans ensure that improvements made during a project are sustained over time by outlining steps and metrics for ongoing monitoring. Integrating these tools into Six Sigma projects is vital for achieving success, as they provide systematic approaches to identifying, prioritizing, and addressing issues, ultimately leading to more effective and sustainable improvements. By embracing these tools and their principles, organizations can drive continuous improvement and successfully meet their objectives through Six Sigma initiatives.