


How Does Data Analysis Boost Six Sigma Success?
Discover how data analysis enhances Six Sigma's success. Learn the vital role of data-driven insights in optimizing processes and achieving excellence.

Six Sigma is a structured methodology aimed at improving processes by minimizing defects and variations. It emphasizes data-driven decision-making to achieve high levels of quality and efficiency. Central to Six Sigma is the DMAIC (Define, Measure, Analyze, Improve, and Control) process, which provides a framework for problem-solving and continuous improvement.
Data analysis is extremely important in Six Sigma as it enables teams to grasp process performance, identify root causes, and accurately gauge improvement opportunities. Through systematic data collection and analysis, organizations can make informed decisions, prioritize improvement efforts, and monitor progress effectively. This evidence-based approach ensures that solutions are grounded in data, fostering sustainable and impactful results. Ultimately, Six Sigma relies on rigorous data analysis to propel process enhancements and elevate organizational performance.
Understanding Data in Six Sigma
In Six Sigma's DMAIC process, data plays a key role at every step. It starts in the Define phase, where data clarifies project goals and sets performance standards. Then, in the Measure phase, data collection checks how processes are working and spots areas for improvement. As the Analyze phase kicks in, data helps find out why problems occur. This leads to the Improve phase, where solutions are based on what the data shows. Even in the Control phase, data keeps things on track by monitoring progress and making sure improvements stick.
Data-driven decisions are vital in Six Sigma. Instead of guessing, teams rely on data to understand how processes work and where they can be improved. This helps them make smart choices, focus on what matters most, and see how things improve over time. By using data this way, Six Sigma ensures that changes are based on facts, leading to steady improvements in how things get done.
What are the types of data used in Six Sigma?
In Six Sigma projects, various types of data are utilized during the analysis phase to identify root causes and develop effective solutions.
-
Quantitative data involves numerical measurements and is crucial for statistical analysis in Six Sigma. It provides precise information about process performance, such as cycle times, defect rates, or production outputs. Quantitative data allows for rigorous analysis using statistical tools like histograms, control charts, or regression analysis, helping teams identify patterns, trends, and correlations within the data.
-
Qualitative data, on the other hand, involves descriptive information such as observations, interviews, or customer feedback. While not numerical, it offers valuable insights into subjective experiences and perceptions, complementing quantitative data analysis. Qualitative data helps uncover non-quantifiable factors influencing process performance, such as employee attitudes, communication issues, or organizational culture.
-
Process data refers to information directly related to the steps and activities within a process. This data includes parameters, inputs, outputs, and performance metrics specific to the process under evaluation. Process data helps understand process flow, identify bottlenecks, and pinpoint areas for optimization by analyzing workflow diagrams, process maps, or value stream maps.
-
Performance data measures outcomes and results achieved by the process. It includes metrics such as defect rates, cycle times, or customer satisfaction scores, providing indicators of process effectiveness and efficiency. Performance data helps evaluate the impact of process improvements and track progress toward project goals throughout the implementation phase.
By analyzing these different types of data in the analysis phase, Six Sigma teams gain a comprehensive understanding of process performance and uncover opportunities for improvement. This data-driven approach enables informed decision-making and ensures that solutions are tailored to address the specific needs and challenges identified within the process.
Data Collection Methods
Selecting the right data collection method for a Six Sigma project is vital. It depends on what the project aims to achieve, how broad it is, and the resources available. The chosen method should give data that is relevant, accurate, and helpful for making changes. For instance, surveys work well for getting customer opinions, while observing the process directly is better for finding where things slow down. Picking the best method ensures that Six Sigma teams get useful information to make smart decisions and improve processes effectively.
In Six Sigma projects, several data collection techniques are employed to gather information effectively:
-
Surveys and questionnaires: These tools collect data by asking individuals to respond to predefined questions. Surveys and questionnaires are useful for gathering subjective feedback, opinions, or perceptions from a large number of respondents.
-
Process observation: This method involves directly observing the process in action to gather real-time data on workflow, activities, and interactions. Process observation provides insights into actual process performance and identifies potential areas for improvement.
-
Data logging and monitoring: Data logging involves recording process parameters, events, or transactions over time using automated systems or sensors. Monitoring systems continuously collect data on process performance, enabling real-time analysis and identification of deviations from desired standards.
-
Sampling methods: Sampling involves selecting a subset of the population or process for data collection. Various sampling techniques, such as random sampling, stratified sampling, or systematic sampling, are used to ensure that the collected data is representative of the entire population or process.
Data Analysis Techniques
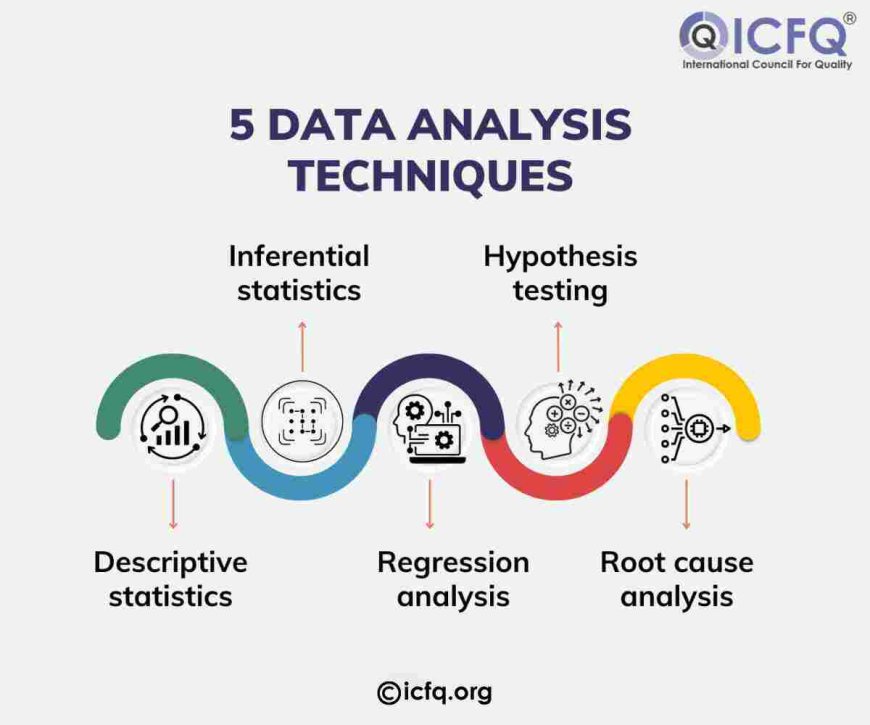
In Six Sigma, various data analysis techniques play a crucial role in identifying opportunities for improvement:
-
Descriptive statistics: Descriptive statistics summarize key features of a dataset, such as averages, ranges, and distributions. By providing a clear picture of current process performance, descriptive statistics help identify areas where improvements may be needed.
-
Inferential statistics: Inferential statistics allow practitioners to conclude a population based on a sample of data. By analyzing sample data and making predictions about the wider population, inferential statistics help pinpoint areas with significant deviations or trends that warrant further investigation.
-
Regression analysis: Regression analysis examines the relationship between variables to identify patterns or trends. By analyzing how changes in one variable affect another, regression analysis helps uncover factors influencing process performance and identifies areas for targeted improvement.
-
Hypothesis testing: Hypothesis testing evaluates whether observed differences or relationships in data are statistically significant. By testing hypotheses about process parameters, hypothesis testing helps determine if changes made to the process lead to meaningful improvements.
-
Root cause analysis: Root cause analysis delves into the underlying reasons or causes of problems within a process. By systematically tracing issues back to their origins, root cause analysis helps identify fundamental flaws or inefficiencies in the process that can be addressed to drive improvement.
Data Visualization
Data visualization is crucial for conveying insights clearly and understandably. Charts and graphs present data visually, making complex information easier to interpret. Pareto charts highlight the most significant factors contributing to a problem, helping to prioritize improvement efforts. Histograms display the distribution of data, revealing patterns and trends. Control charts track process performance over time, identifying variations and deviations from desired standards.
Visual representations of data aid in decision-making and communication by presenting information in a visually compelling format. They allow stakeholders to quickly grasp key findings, trends, and relationships within the data, facilitating informed decision-making. Moreover, visualizations enhance communication by providing a common language for discussing data-driven insights among team members and stakeholders. By leveraging visualizations effectively, Six Sigma teams can communicate findings more effectively, align stakeholders around improvement priorities, and drive meaningful change within the organization.
Role of Data Analysis in Continuous Improvement
Data analysis is integral to continuous improvement in Six Sigma as it provides the foundation for identifying areas of opportunity and driving meaningful change. By analyzing data, Six Sigma teams can identify trends, patterns, and root causes of problems within processes, allowing for targeted interventions and improvements. Data-driven decision-making ensures that changes are based on evidence rather than assumptions, increasing the likelihood of success.
Monitoring and analyzing data over time is essential for sustaining improvements achieved through Six Sigma initiatives. By tracking key performance metrics and process indicators, organizations can identify deviations from desired standards and take corrective action promptly. Continuous data analysis enables organizations to identify emerging issues, assess the effectiveness of implemented solutions, and make necessary adjustments to maintain improvements over the long term. This proactive approach to data monitoring and analysis ensures that processes remain efficient, effective, and aligned with organizational goals, driving ongoing success and continuous improvement.
In Six Sigma, data analysis is essential for success, guiding every step of the process. By analyzing data, teams gain insights into how processes perform and where improvements can be made. It's crucial to use data effectively to drive continuous improvement initiatives, ensuring that processes become more efficient and effective over time. By making decisions based on data, organizations can identify and fix problems, leading to better quality and customer satisfaction. Embracing data-driven approaches fosters a culture of innovation and excellence, enabling teams to consistently improve and stay competitive.